

Reporting on Your Web Accessibility Findings: It Can Be Easy Using the GOALS Tool
If you are involved in formal web accessibility work on your campus, it is likely that you need to provide annual reporting to an administrator. Most often this is a VP, Dean, or Provost. Sometimes it can be a report for your Chancellor, President, or Board of Trustees. If a complaint or litigation on web accessibility arises, you may even be involved in submitting annual reports to an attorney or advocacy group. No matter the recipients, reporting is an important element in the overall efforts of your institution.
Reports help key decision-makers act on matters that can affect policy, strategic plans, budget considerations, and oversight of institutional priorities. Moreover, it is key to documenting your efforts on an annual basis. Reporting is important if you want to show others that you are working toward accessibility in a way that is meaningful, with goals and objectives anchored in justifiable activities with timelines. Such documentation can be helpful for those in disability services, IT, risk management, or the institutional attorney; it can also document that a transition plan is in place and on track.
One struggle for many accessibility leaders on campus is the exorbitant amount of time necessary to generate a formal report that contains adequate detail to paint an institutional picture. Estimates are upwards of 20 hours to create an institutional report, complete with an executive summary, a description of your process (i.e., purpose, methodology), all institutional findings, and recommendations for action. Those tasked with overseeing accessibility on your campus may be interested in a tool that can generate an easily editable initial draft report using existing data.
One of the features of the GOALS Benchmarking and Planning tool is a suite of reporting functions. Once the self-study team concludes their work (i.e., to complete any indicator that is relevant for their institution, and engage in an action plan), the Team Leader can generate reports for (1) how their institution performed on the Benchmarks, (2) what the team proposes as an Action Plan, and (3) a more formal Administrative Report that captures the entire process.
This resource will walk you through creating and understanding the structure of the Administrative Report.
Actual reports are also provided as examples.
When you are ready to create a report, go into the “Report” tab. There you will find the first step to generate the Administrative Report. All data you entered earlier in your responses to benchmarking and planning will be pulled automatically into this report, then you will be able to edit the draft into a final product ready for dissemination.
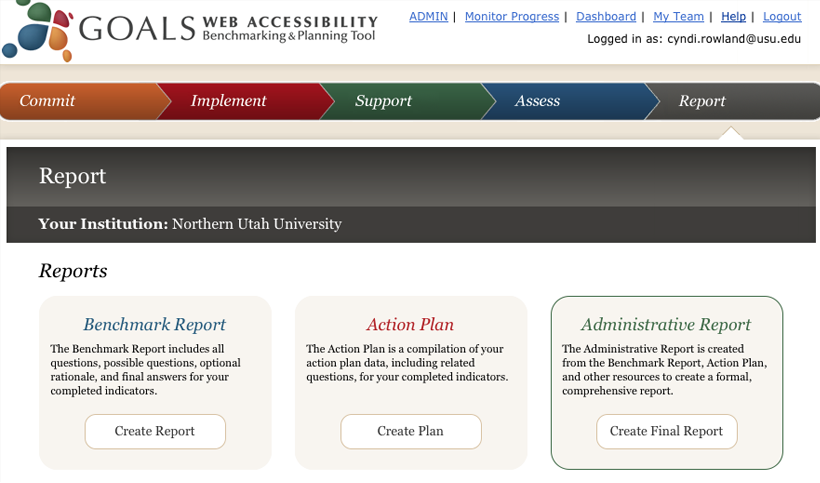
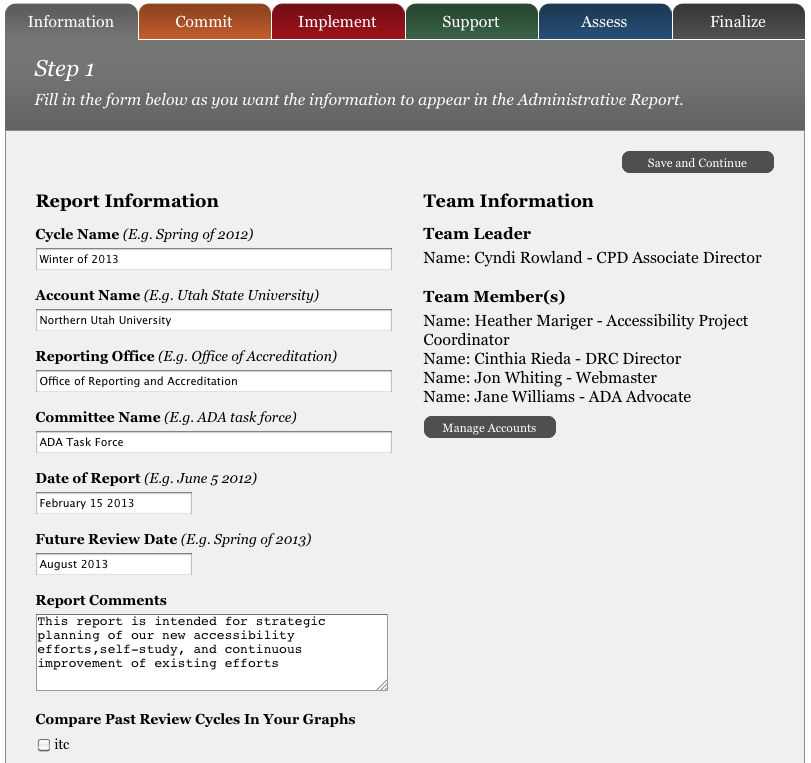
There is some information necessary for a formal report not gathered during the GOALS benchmarking and planning process. Examples would include reporting dates, staff titles, the committee who did the work, and the office to which this committee reports. Since the developers of the GOALS tool did not want to force all users to provide this information, completing it is the first step to generate the Administrative Report.
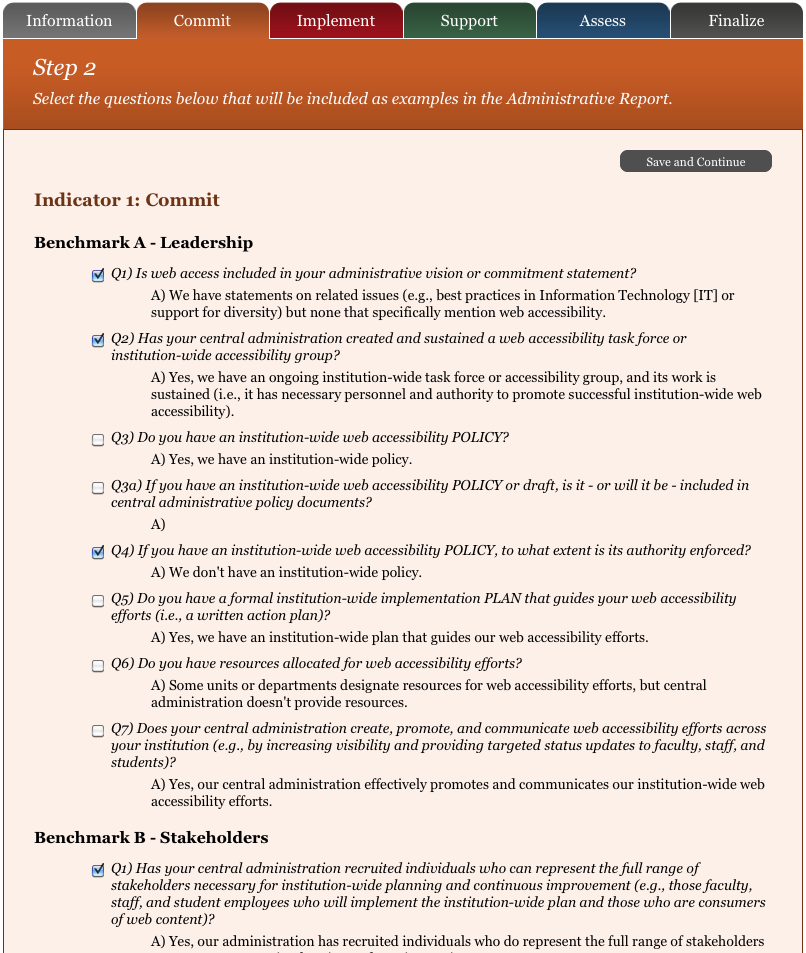
The second through fifth steps are to select content you would like to appear in the report narrative from benchmarks across each of the four indicators (i.e., Commit, Implement, Support, and Assess). If your study team evaluated only one or two indicators, that is fine; you can select report information for only those indicators. This selected content will appear as examples to illustrate your findings. While your committee may have generated a lot of interesting information, you will only want to provide a few examples for each benchmark you choose to include. Typically, examples selected include areas where your institution is doing particularly well and also areas where you see the need for immediate improvement or growth.
Looking at the illustration of Step two, you will see the responses that were selected. These will be included in the report draft. This Team Leader wanted to highlight two examples of leadership commitment to campus wide accessibility and one area for potential growth.
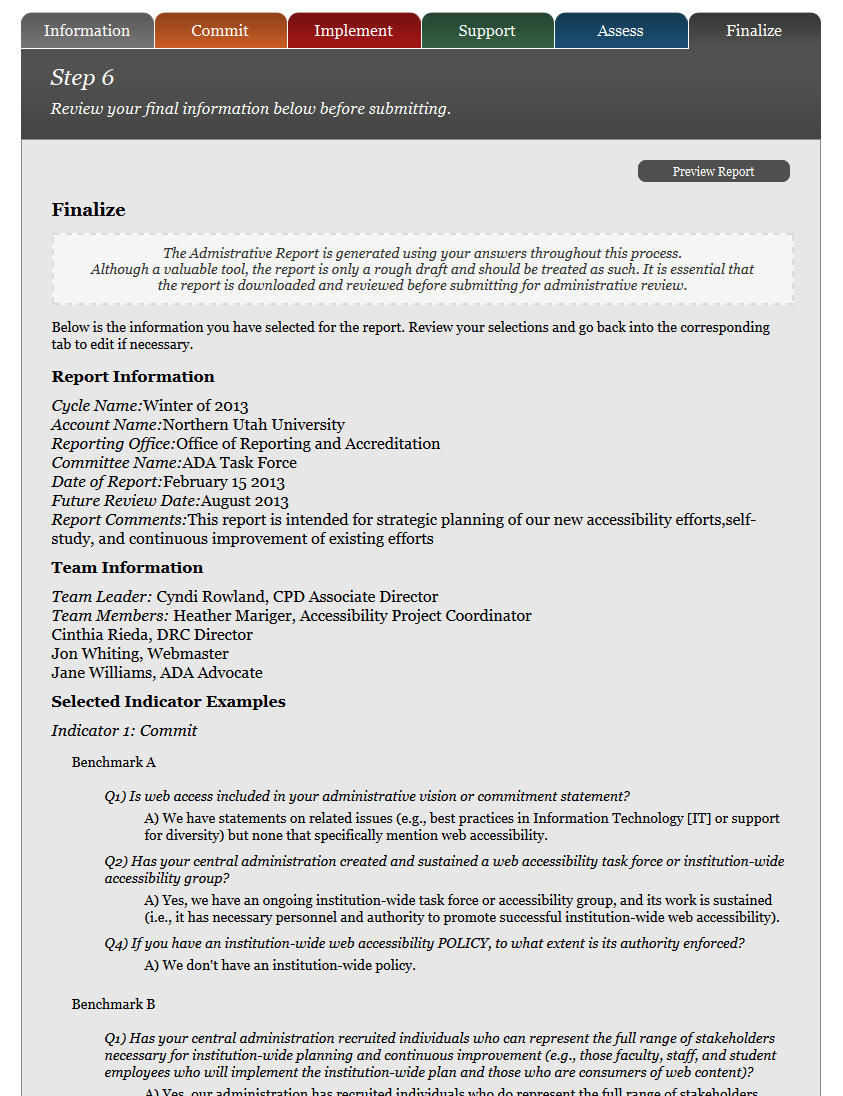
When you are finished going through each indicator by benchmark (i.e., to determine the content you would like brought forward into your report), it is time to engage in step six, previewing the content that will be included in the structure of the report. If you need to go back and edit any of the steps, you can do so until the information is exactly the way you want it to appear.
The report itself is organized in a fairly straightforward manner; sections include the Cover Page, followed by the Executive Summary (i.e., of the process, findings, and recommendations). The Full Report follows; it begins with an Introduction to the purpose of the institutional self-study of web accessibility as well as a section on the Methodology used to complete the study. Findings are presented next, organized by each of the four indicators. Each indicator section starts with a description of “What it Means”, and then moves to “What we Found” with charts showing institutional performance, the section concludes with “Why it is important”. The final section is for Recommendations - the committee's work on action planning is brought forward into the draft report. Recommended actions for any indicator are presented along with the persons responsible and any timelines or notes provided.
Once you have downloaded the draft report format of choice (HTML or Word), you will be able to start editing. The GOALS staff does not recommend that a report go out without this critical step! The findings at each institution are unique and deserve to be captured with relevant detail and institutional context. Also, grammatical errors are likely to be present in the automatically generated report draft. Moreover, your institutional report may need to capture some elements not anticipated within the GOALS process.
With permission, we have used a report generated by the Accessibility Committee of Augsburg College as an example. The Draft Report is the actual report as the GOALS tool initially generated it. The Final Report is the report used by the Accessibility Committee to disseminate through administrative channels. Moreover, the Committee posted the Executive Summary onto their website to document the work of the Committee and the action steps that would be taken by the institution. Erin Voss, Team Leader for the self-study at Augsburg indicated that there was value in using the GOALS auto-report function. She stated; “I had a starting point for arrangement of the information, and for description of the benchmarks and why they're important. I didn't have to put as much brain time into those things”. In terms of her time to edit the content, she indicated that “I'd say I did 2-3 hours of actual re-wording, original writing, and other editing . . .” All in all, it gave her a great start to completing a formal report in an efficient way.
While the FIPSE-funded project ended, we continue to offer access to the self-study tool. If interested please Contact Us.